Every Android app lives or dies by how well it performs in the real world. Users don’t care how clever your architecture is if the app lags, crashes, or burns through battery. That’s where android app performance testing comes into play. Tracking the right metrics isn’t just nice-to-have — it’s essential to deliver experiences people stick with and recommend.
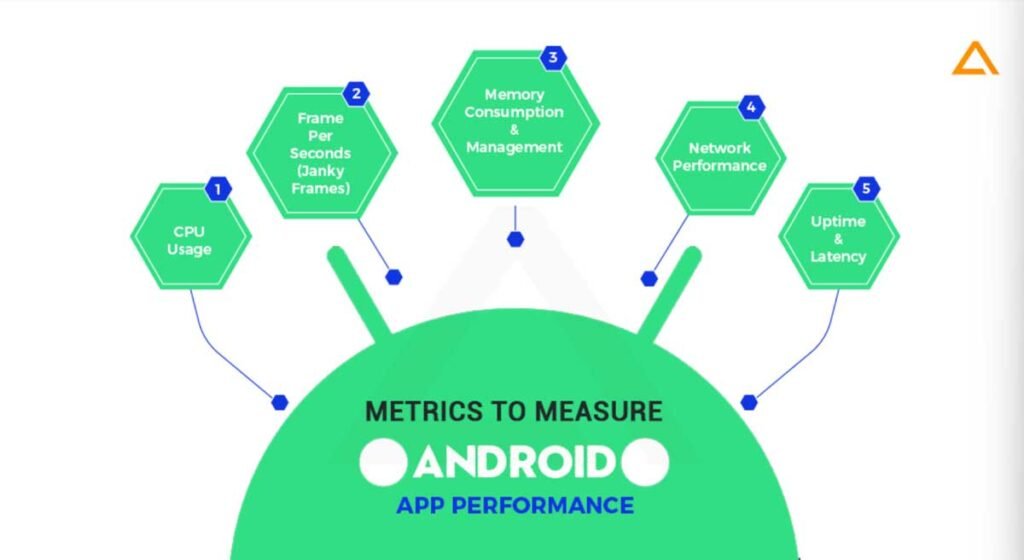
Performance isn’t just technical data. It shapes user perception, retention, session length, and ultimately the success of your product. But what should you actually measure? Let’s break down the key performance metrics every Android team should be watching.
Table of Contents
Toggle1. App Launch Time
When a user taps your app icon, they expect it to start instantly. Launch time measures how long it takes from that tap to when the first meaningful content is visible.
Slow startup times increase abandonment and give a lousy first impression. Industry guidance even suggests aiming for cold starts under 500 ms when possible. This metric is both technical and user-centric — it shows how responsive your app feels out of the gate.
2. Crash Frequency and Stability
Nothing kills user confidence like unexpected crashes. Crash frequency measures how often your app exits or fails due to errors during use.
This is one of the most critical performance testing KPIs because it directly correlates to user retention. High crash rates almost always lead to bad reviews and uninstalls. Tools that report the frequency, context, and device/OS mix of crashes are valuable because they let you prioritize fixes where they matter most.
3. Load Times for Key Screens
Beyond startup, screens such as home, search, or checkout must load quickly.
Users notice delays in navigation more than a lot of other things. Measuring screen load time reveals performance bottlenecks in backend APIs, rendering, or resource loading. In android app performance testing, this data helps you pinpoint whether delays stem from server latency or client processing.
4. Memory and CPU Usage
Your app can do all the right things and still feel sluggish if it eats memory or CPU unnecessarily.
High memory usage can lead to OS-triggered kills or jank (choppy animations and scrolls). CPU spikes drain battery and slow down interactions. Monitoring these resource KPIs gives insight into efficiency and lets you optimize, not just test functionality.
5. Network Performance
Apps today rely heavily on server communication. Metrics like API response times, failed request rates, and time to first byte tell you whether the network layer is holding up under real conditions. Poor network performance directly impacts perceived speed and can even lead to data corruption or hangs if not handled gracefully. In performance testing, simulating varied network conditions ensures your app doesn’t just work in the office Wi-Fi — it works anywhere.
6. Battery and Data Usage
Android devices vary widely in hardware and battery capacity. Aggressive use of background services, location APIs, or inefficient loops can drain power and data quickly.
Users may uninstall an app that drains data or battery even if it “works correctly.” Tracking energy impact and data usage is critical for long-term engagement and quality user experience.
7. User Engagement and Retention Metrics
Performance isn’t just about tech — it affects behavior. Metrics like Daily Active Users (DAU), Monthly Active Users (MAU), Session length, and Retention and churn rates, reveal whether users find your app compelling enough to keep using it. Slow or unstable apps usually show poor retention and high churn. Teams need these behavioral KPIs alongside purely technical ones to understand how performance impacts success.
8. Error and Exception Rates
Not all errors crash the app, but unhandled exceptions or repeated failed states degrade experience slowly.
Tracking error rates, from API failures to UI exceptions, helps identify weak spots in resilience. When combined with crash data and user behavior, this metric paints a fuller picture of app health.
9. Throughput and Load Handling
For apps with significant backend interaction, throughput — how many operations per second the system handles — matters.
This metric is especially important during peaks, such as promotions or live events. Performance testing under load reveals thresholds where user experience begins to degrade.
Choosing What Matters Most
Your app won’t need every KPI all the time. Stage of development, expected usage patterns, and business goals determine priority. But these metrics are a solid foundation for any Android team serious about performance.
Tracking them as part of android app performance testing helps you catch issues early, optimize critical paths, and deliver an experience that keeps users coming back.
How HeadSpin Can Help
Understanding and tracking performance metrics is just the start. HeadSpin gives you a powerful platform to observe and test Android app performance on real devices, real networks, and real user conditions worldwide.
You can automate KPIs like load times, crash frequency, API responsiveness, and resource utilization across devices and geographies that reflect your actual user base. With session-level insights, performance baselines, and trends, HeadSpin helps teams diagnose and fix issues quickly — not after users have already noticed. If your goal is to build faster, more stable Android apps that retain users and outperform competition, HeadSpin gives you the data, scale, and context to make it happen.